

business
TEXINFRA: 1-3 Yr Thesis on Asset Value & Breakout Levels
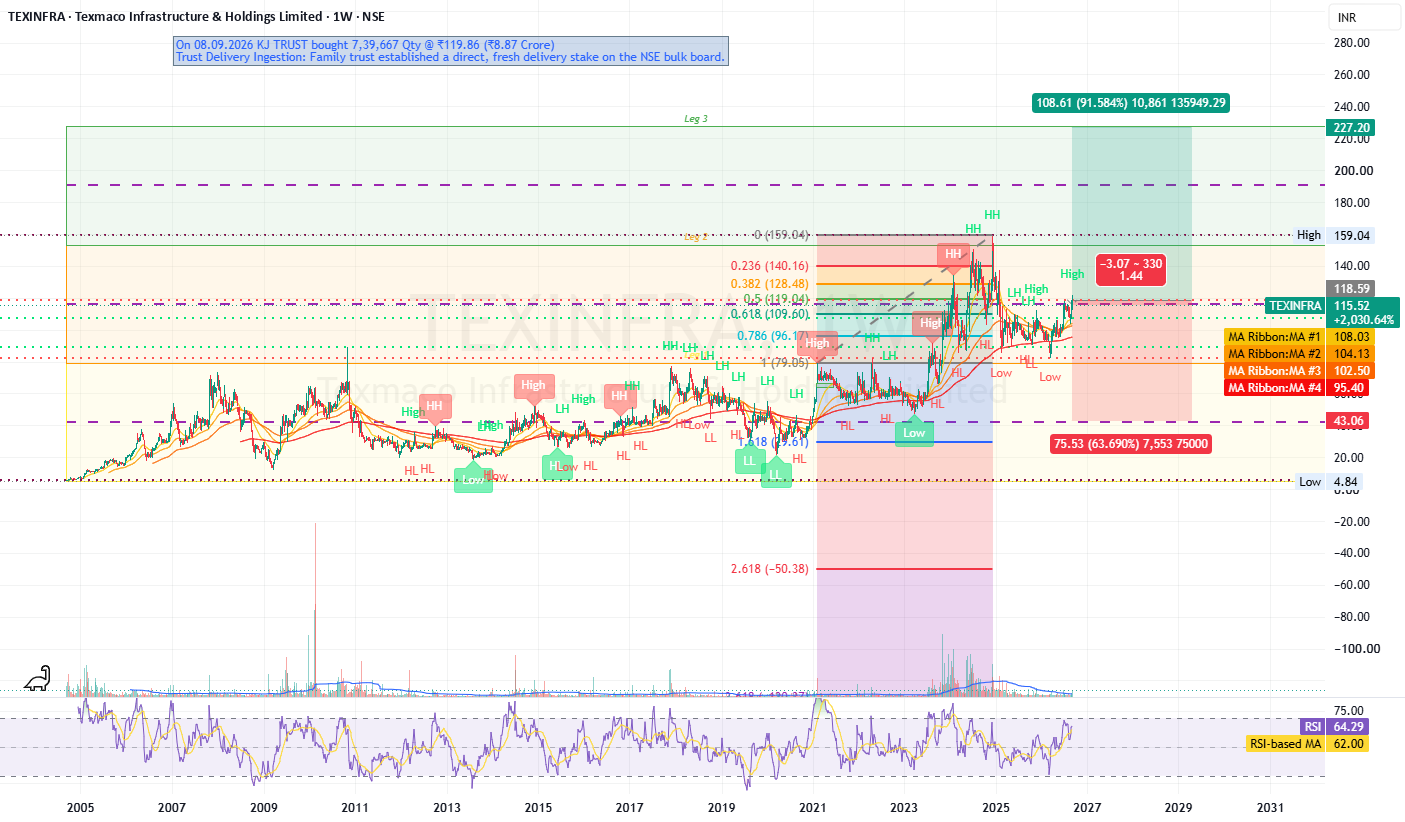
TEXINFRA (Texmaco Infrastructure & Holdings Limited) is currently trading at ₹115.52, presenting a unique setup as a financial holding and infrastructure asset play. While the core operating business shows weakness with negative operating income, the company's valuation relies heavily on non-operating income, asset backing, and potential catalysts like a reported ₹11,140 crore arbitration award. Technically, the stock is building a constructive macro base, although its exorbitant P/E multiple demands strict level management for a 1-to-3-year holding horizon. Trend Confirmation: The technical structure is constructively bullish across higher timeframes. Price action sits comfortably above both the 50-day (₹113.01) and 200-day (₹102.36) SMAs. The daily technical gauge signals a "Buy" (RSI at 55.88, MACD at 1.42), while the weekly frame flashes a "Strong Buy." An ADX of 27.7 indicates a trending environment, though momentum is not overstretched, favoring accumulation on pullbacks rather than chasing breakouts. Key Levels & Volume Context: Resistance: The immediate hurdle is the ₹116.11 monthly pivot. The critical breakout zone lies between ₹121.21 and ₹121.80 (Prior Month High & R1 pivot). Clearing this ceiling confirms a fresh leg toward the Value Area High (VAH) at ₹136.59. Support: Immediate structural support rests at the ₹111.00 – ₹112.45 shelf (a confluence of the prior month low and a broken Fibonacci 100% resistance). The macro volume-backed floor, or Point of Control (POC), sits solidly at ₹102.23 (the highest-volume price over the last 180 weekly bars). Directional Bias: Cautiously Bullish (1–3 Years). The setup favors a long-term hold conditional on price sustaining above the ₹111.00 pivot low. A weekly close below ₹111.00 breaks the higher-low sequence, while a decisive drop below the ₹102.23 POC would invalidate the bullish thesis entirely. Fundamental History (FY2020–FY2025): The 5-year trajectory shows flat-to-choppy top-line performance. Revenue was ₹147.5M in FY2020, dipped mid-cycle, and rebounded to ₹174.6M in FY2025 (+10.0% YoY). Profitability has been highly volatile, swinging from a massive ₹862.5M net loss in FY2021 to a ₹109.3M net profit in FY2025. TTM EPS stands at ₹0.71. The TTM net margin is an exceptional 53.25%, but this is entirely driven by non-operating income, as gross profit and operating income remain negative. Total debt drifted lower from ₹318.1M in FY2023 to ₹280.5M in FY2025. (Note: ROE/ROIC metrics are unavailable for this holding structure). Sector Comparison: When compared to NBFC peers like Shriram Finance (P/E 18.2), Cholamandalam (P/E 27.3), and Bajaj Finance (P/E 31.8), TEXINFRA's P/E of 162.4 is vastly inflated, representing a 704% premium to the sector median. Its 5.5% YoY revenue growth also lags the peer group. However, its Price-to-Book (P/B) ratio of 1.4 sits 25% below the sector median, reflecting its true valuation as an asset-heavy holding company rather than a traditional lender. Data References: Data sourced from TradingView and NSE consolidated fundamentals. Data cut-off is September 13, 2026. The reported ₹11,140 crore arbitration award is treated as a fundamental backdrop, though exact dates are unverified in the core data stream. Disclaimer: This information is only for knowledge sharing and no investment advise and I am not a SEBI Reg. Advisor.
Read full article on Tradingview
Related News